A Geospatial Study of Opioid Overdose Risk
Topological Data Analysis + Deep Learning
Published Research (IJPDS 2024)
Topological Data Analysis, Persistence Images, SE-ResNet, PyTorch
A Geospatial Study of Opioid Overdose Risk in Diverse Regions
Turning census-level socioeconomic data into topological shape descriptors, then classifying high-risk opioid overdose counties with a multi-dimensional deep learning model.
Supervisor: Dr. Adam Spannaus (Research Scientist; Oak Ridge National Laboratory, USA)
Authors: Hashan Fernando, Adam Spannaus, Anuj J. Kapadia
Additional Resources: Paper · Git Repository · Poster
Predicting which counties are most at risk of opioid overdose usually means feeding socioeconomic factors ;poverty, unemployment, disability, straight into a model as numbers. That approach throws away something important: where vulnerability is concentrated within a county matters as much as how much of it there is. Two counties can share the same average poverty rate while looking completely different on the ground: one with poverty clustered in a single hotspot, the other spread evenly across every census tract.
This project uses Topological Data Analysis (TDA) (Feng & Porter, 2021) to capture exactly that shape information, then feeds it into a deep learning classifier. Each Social Vulnerability Index (SVI) variable for a county, poverty, unemployment, disability, and others, is converted into a "persistence image" that encodes how its high-risk census tracts cluster and connect geographically. Stacking these persistence images across variables gives each county a multi-channel topological fingerprint, which an SE-ResNet then learns to classify as high or low overdose risk. This work was published at the International Population Data Linkage Conference 2024 (Fernando et al., 2024).
From census tracts to a risk classification
Four stages turn raw, subregional socioeconomic data into a single risk prediction per county.
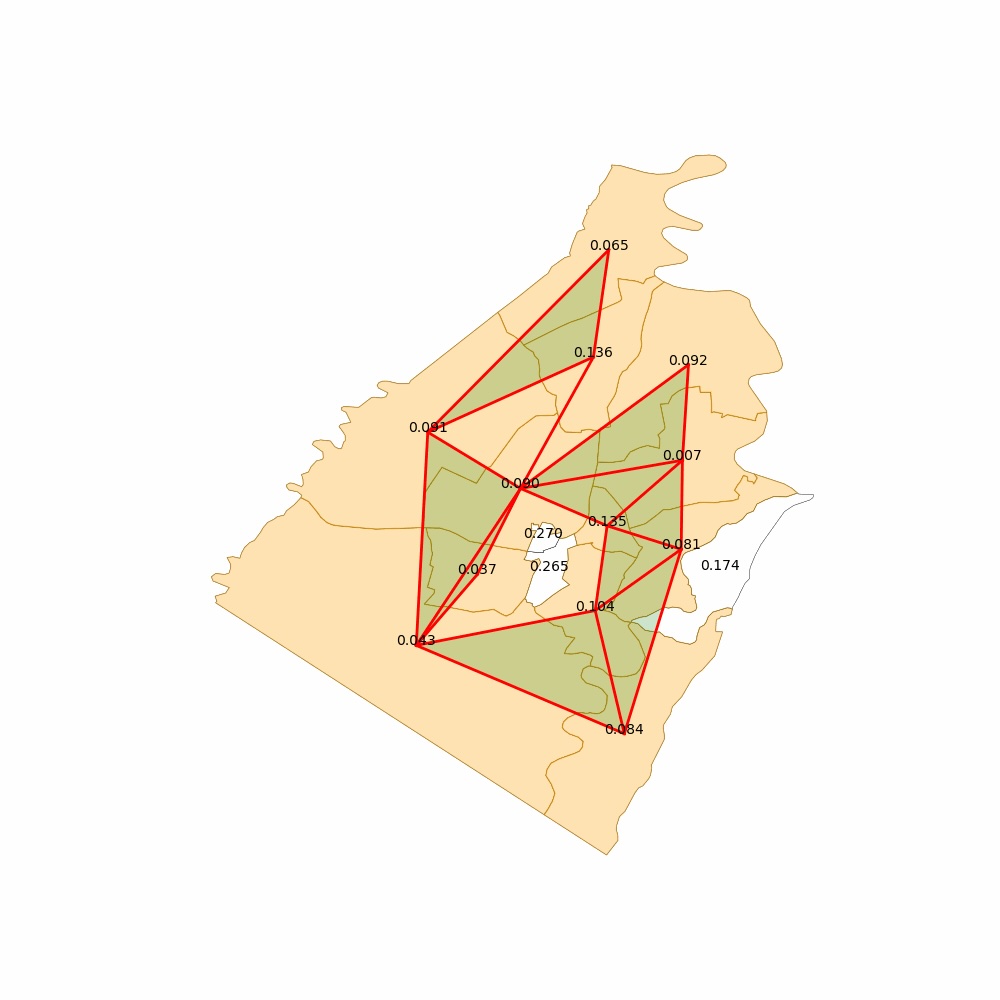
Adjacency Complex
Census tracts within a county become nodes of a network, connected whenever they share a geographic border. Thresholding each SVI variable over this network builds a distinct topological structure per variable.
Persistence Diagrams
Tracking the network as the threshold sweeps through the SVI variable's value range reveals which clusters of high-vulnerability tracts are real structure versus noise, recorded as birth/death pairs in a persistence diagram.
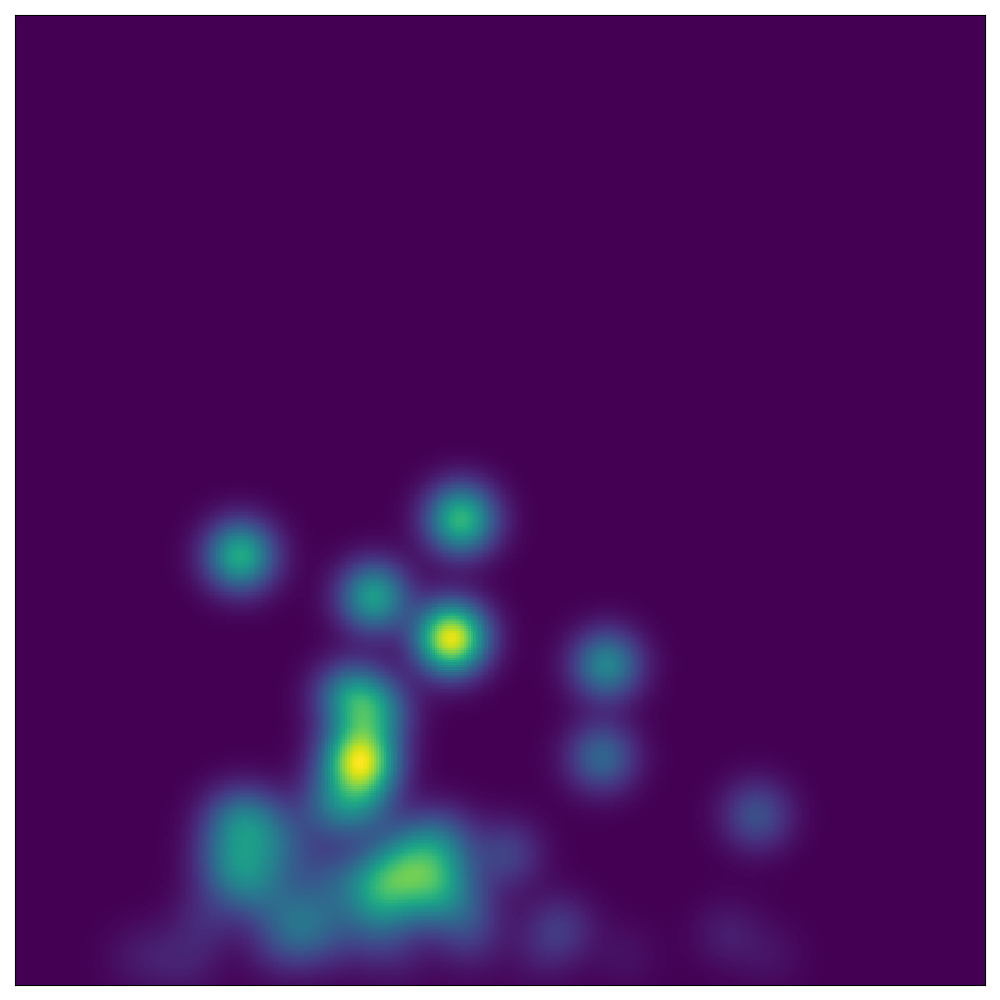
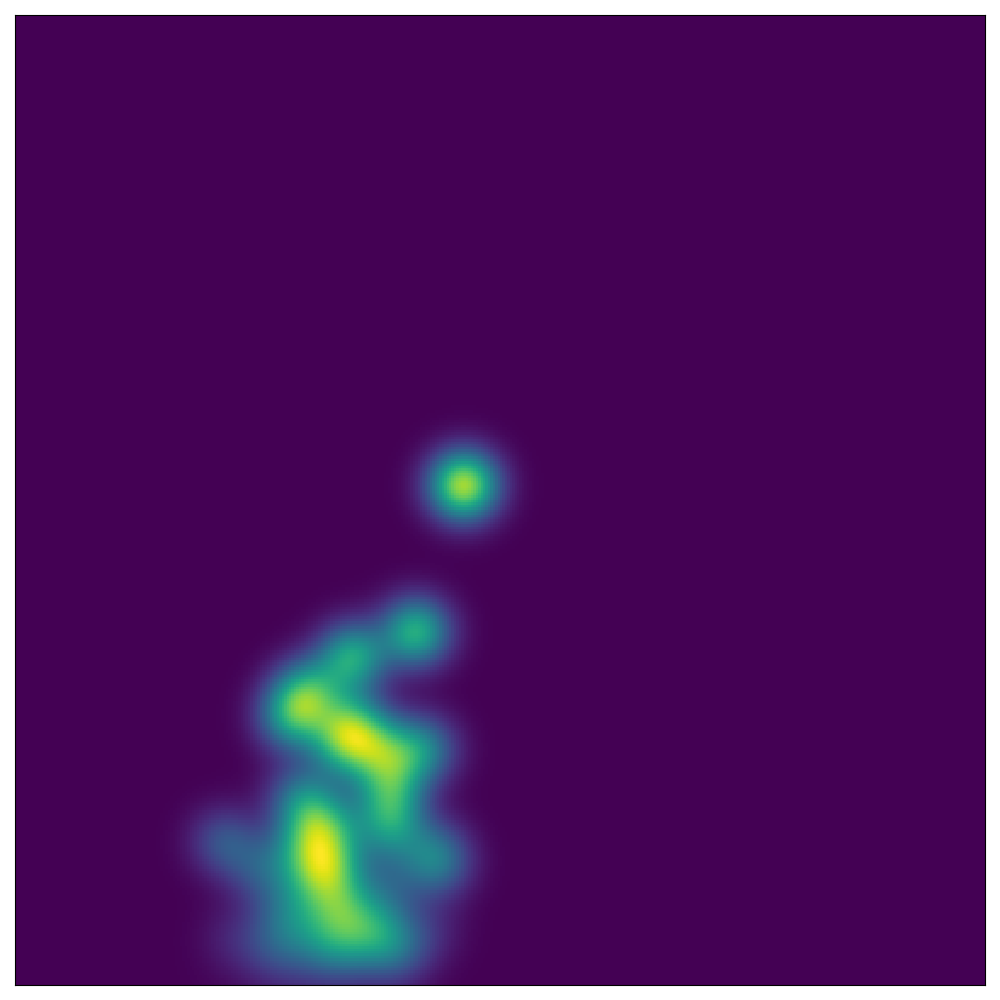
Persistence Images
Persistence diagrams are multisets, not fixed-size vectors, so they can't feed a neural network directly. Each diagram is mapped onto a fixed birth-persistence grid and Gaussian-smoothed into a 2D image a CNN can use.
Multi-Channel Classification
Every county's per-variable persistence images are stacked into one multi-channel input. An SE-ResNet adaptively weighs each channel to classify the county as high- or low-overdose risk.
Built with
Three risk-strata models
Separate classifiers were trained to flag counties in the top 5%, top 10%, and top 20% of overdose risk nationally.
Can the model flag the most extreme overdose-risk counties correctly?
Labeling the top 5% of counties nationally as high-risk creates a highly imbalanced classification problem.
Solution
90% test accuracy. The high-overdose class reached a 0.95 true positive rate with only a 0.18 false positive rate; the model is sharpest at the extremes.
What happens as the risk boundary gets less extreme?
Widening the high-risk label to the top 10% of counties pulls more borderline cases into the classification.
Solution
75% test accuracy, with the low-overdose class holding a strong 0.93 true positive rate. The high-overdose class becomes harder to separate (TPR drops to 0.57) as the boundary loosens.
Does the model still add value at a broader, noisier risk boundary?
At the top 20% threshold, nearly a fifth of all counties are labeled high-risk, and the class boundary is far less distinct.
Solution
65.74% test accuracy. Performance degrades as expected with a noisier label, but the low-overdose class still holds a 0.92 true positive rate; the model consistently identifies genuinely low-risk counties.
Planned next steps: adding a temporal component to forecast future high-risk counties rather than only classifying current ones, extracting a richer set of features from each persistence diagram, and exploring graph neural networks as an alternative to the image-based CNN approach.
Figures
References
2024
2021
- Persistent homology of geospatial data: A case study with votingSIAM Review, 2021